Modeling and density estimation of Heterodera schachtii populations


The pattern of age structure distributions
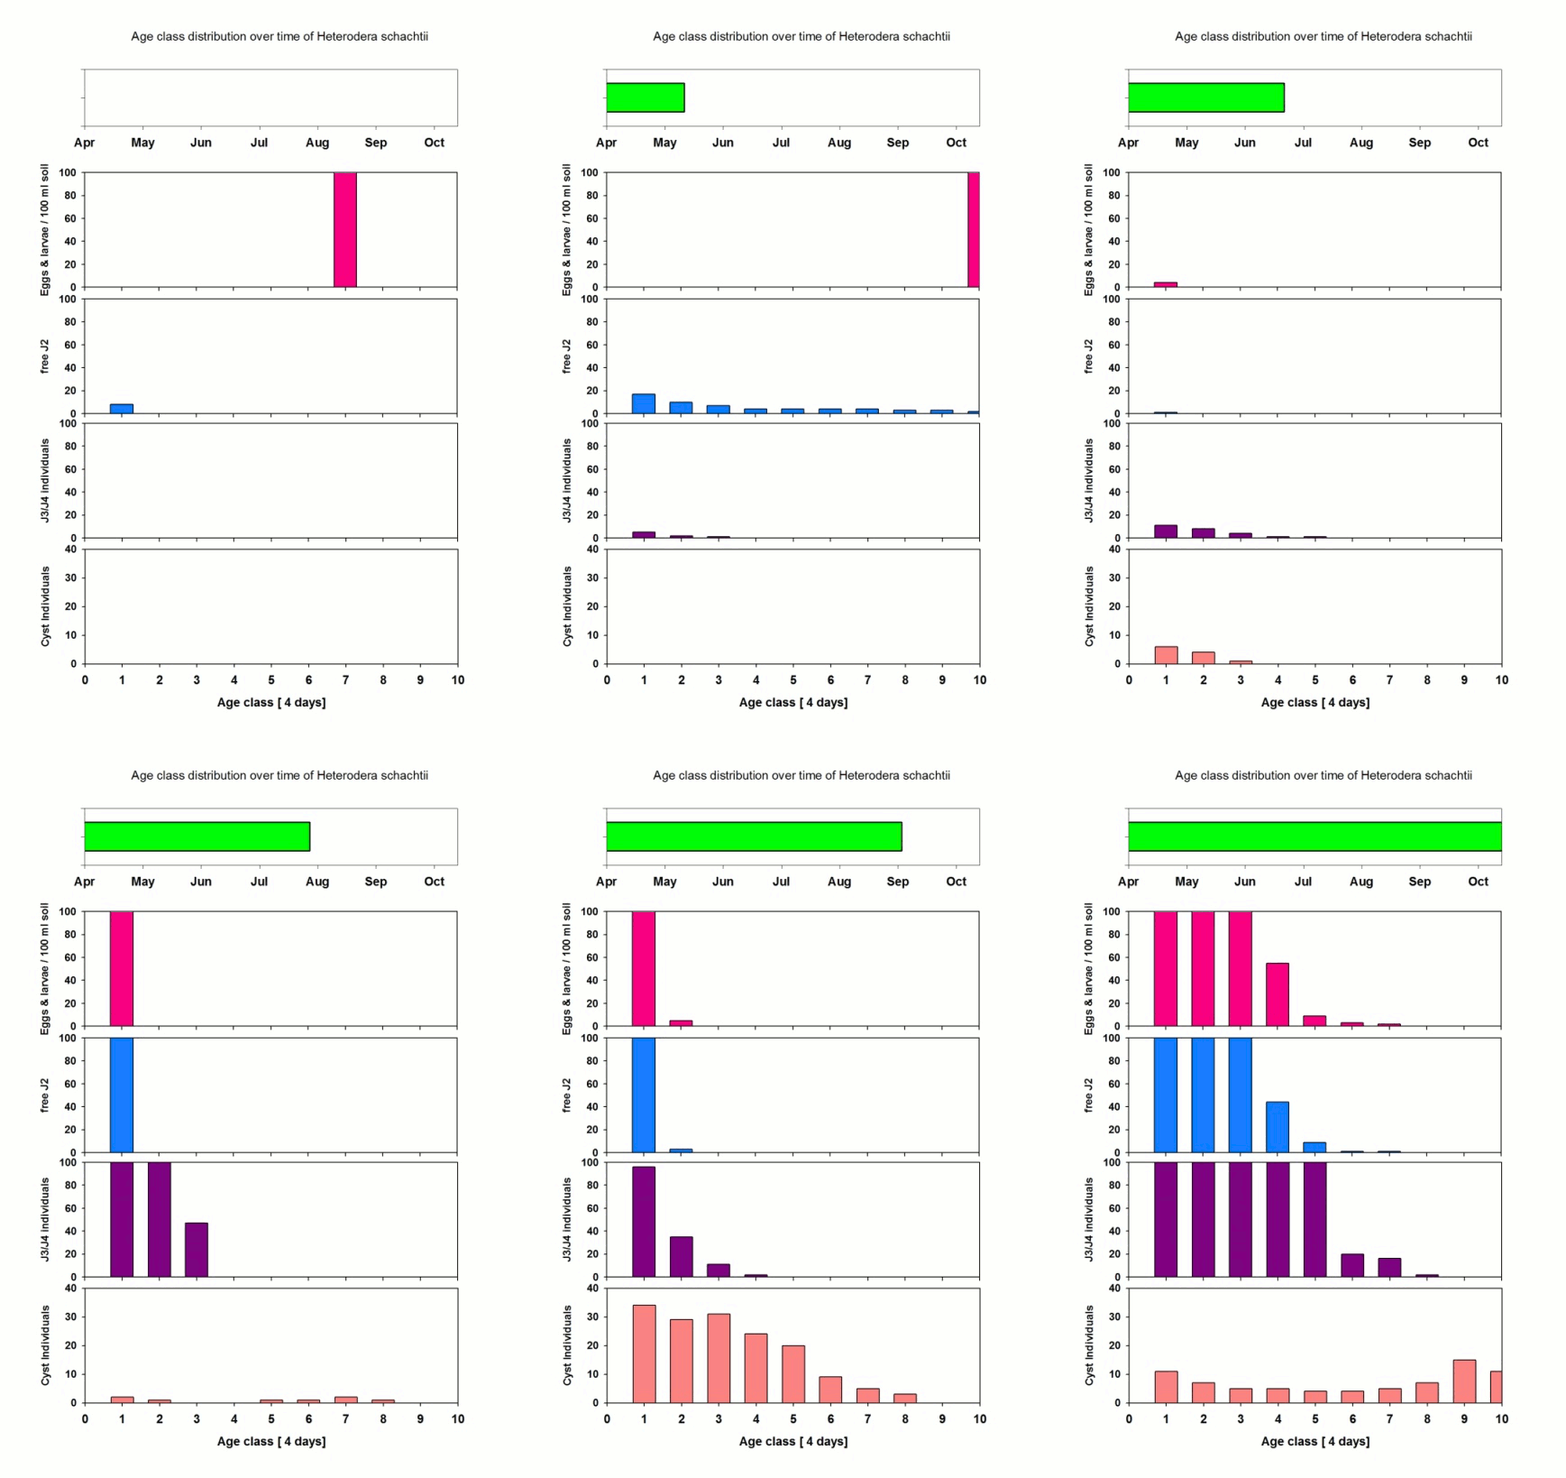
The animated GIF chart of the age class distribution of H. schachtii over time. The eggs hatch with the existence of a crop to the first age class of the stage "free J2" of the first generation. These Juveniles survive with a certain probability and move on the next age class, a.s.o. In case of a successful penetration of suitable fine roots the J2 hatch into the next development stage J3 and the process described so far continues. To keep the animation as simple as possible both all Juvenile stages in the crop and the stages adult and cyst have been combined. New eggs will develop with an age dependent probability in the new cyst building the next generation. As H. schachtii has no diapause and a sufficient amount of fine root is available at this time, the new Individuals will hatch quick and spontaneous, proceeding and completing the second generation.

The age class distributions are more or less theoretical, the individuals of the population are not easily observable within the plant system. They are mainly based on partitioning the real time, linking information from literature, experiments and temperature or other environmental factors. The animation represents a theoretical frame in the first instance, but the model is universally applicable. The age dependent definition of behavior of a population provides the frame to take into account several factors simultaneously. Additionally we can generate different types of variance distributions. Disadvantage: calibration is work intensive due to high correlations of each development stage, the model complexity increases drastically with the number of development stages (and generations). The transition probability (i.e. the probability to get from one stage to the next one) is not only controlled by temperature for BCN, but also vary with the dynamics of the host. The transition probabilities to get from egg to J2 are approaching small values at the end of the season, as just a tiny part of the root/beet system represents fine roots.
 Evaluation reinvented
