Advanced reading: Introduction and overview about the statistics used in the project:
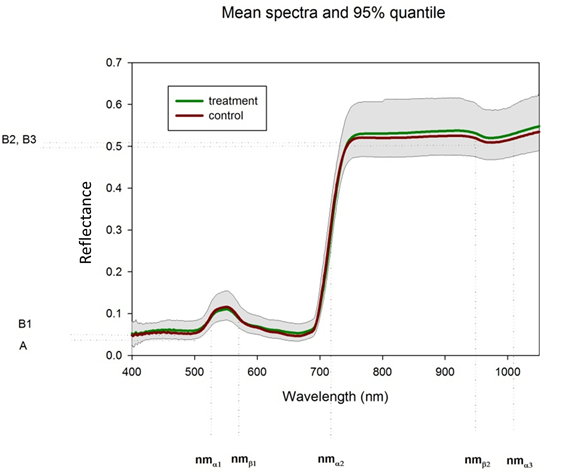
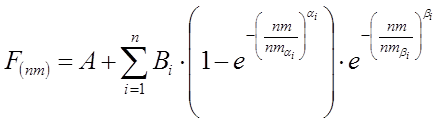
Fig. 1: Labels and domain positions of model parameters
Nemaplot uses the hyperspectral reflectance technology as a non-destructive and non-invasive tool for a fast and
early analysis of field, greenhouse or lab experiments and trait recognition
of biological objects. We have developed and combined several statistical tools to detect and
produce statistical evidence for minor differences in your hyperspectral data.
This approach enables rapid analysis of hyperspectral measurements that are
themselves fast and easy to conduct, making the whole procedure rapid,
effective and affordable. Nemaplot has developed unique methods to detect differences among spectra by a combination of model
fitting, parameter estimation procedures
and multivariate statistics making
otherwise time consuming analysis, simple and effective. The comparison of all parameter estimates (i.e. the whole spectrum)
is used to detect treatment effects. The comparison of the parameters allows the setting of statistical decision boundaries
and allows the comparison of signatures by the significance of the statistical tests. This patented method is
applicable for all spectral reflectance patterns and not reduced for the analysis of vegetation reflectance. We use the complete
spectral information. The common use of indices of variable, restricted domain is certainly a no go method.
To analyse experiments we introduce a dimensionless scale on the base of discriminant functions. These alternative
levels allow us to address the relative differences of the established factor levels. We are delivering a number of statistical parameters
which allow the assessment and classification of reflectance data.
These statistical parameters are:
Common test parameter, as the c2 test and others, determining the discriminating power and group relations, as
well the probability testing for group equality (small p-values means unequal groups, caused by treatment impact for example).
Canonical correlation, a measure of the precision of the discriminant functions. We can use the common classes in the interval of 0 to 1: 0-0.3,
no correlation, 0.3-0.7, poor to medium association, 0.7 - 1.0 high and very high correlations.
Canonical distances, based on an open dimensionless scale, which provide a
quantitative measure and determine the intensities of treatments. As larger the
distance, as larger are the differences among groups. With respect to the
treatment factor, as larger are the treatment effects.
We are not stressing major differences, the visual distinction is more than obvious in such cases and no test is needed (for example
a comparison between a brown and a green leaf), but in the majority of measurements there are apparently no differences in the spectra and treatment effects are not obvious at all.
In comparison to the classical statistical analysis on the base of SI units,
as kg ha-1, etc., this method also provides the facility to analyse multi-factorial
designs and mean comparison. It is most suitable for high
throughput screenings, where treatment related differences (for example due
to fertiliser, induced stresses and pesticide
treatments or genetically related traits) are recognised at early times and development stages.
Nemaplot uses cookies to provide its services. By continuing to browse the site you are agreeing to our use of cookies.
More information (in German only)