Median and quantile
 Ahead of an analysis of hyperspectral information with advanced statistical procedures it it more useful to archive a common overview by using median and 95% quantile calculations.
The dynamics of most stresses are starting with a lag phase, followed by rapid changes, and a final approximation to an upper or lower asymptote. The time courses are fitted well by
sigmoidal functions. Early stress responses are detectable by small changes of the hyperspectral signal, but not all crops respond in the same at the same time. The
natural variance is easily recorded and shown by hyperspectral measurement technique. Hyperspectral data1 were taken from
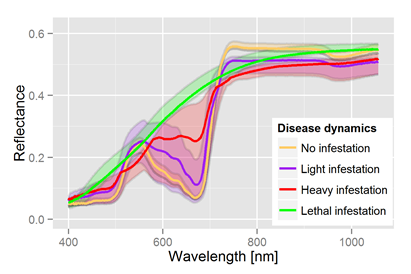
Rhizoctonia solani experiments on sugar beets as an example. The high pathogenicity of the fungi has the potential to demonstrate the complete range (and boundaries) of possible signatures.
A stress free population, for example a field or all crops of a factorial experiment, show high light absorption in the visible domains contemporary with a low and symmetric variance. (fig. 1,
yellow signature)
Ahead of an analysis of hyperspectral information with advanced statistical procedures it it more useful to archive a common overview by using median and 95% quantile calculations.
The dynamics of most stresses are starting with a lag phase, followed by rapid changes, and a final approximation to an upper or lower asymptote. The time courses are fitted well by
sigmoidal functions. Early stress responses are detectable by small changes of the hyperspectral signal, but not all crops respond in the same at the same time. The
natural variance is easily recorded and shown by hyperspectral measurement technique. Hyperspectral data1 were taken from
Rhizoctonia solani experiments on sugar beets as an example. The high pathogenicity of the fungi has the potential to demonstrate the complete range (and boundaries) of possible signatures.
A stress free population, for example a field or all crops of a factorial experiment, show high light absorption in the visible domains contemporary with a low and symmetric variance. (fig. 1,
yellow signature)
Rizoctonia is one of those extreme pathogens, the complete destruction of all crops are not to find that often. But it is an excellent example to demonstrate the whole range (and boundaries) of potential signature patterns. The changes of symmetry in the variance allows the use of related statistical tests.
1Data and the Rhizoctonia image have been provided by Dr. Christian Hillnhütter. More detailed information in Hillnhüter et al., 2012, Use of imaging spectroscopy to discriminate symptoms caused by Heterodera schachtii and Rhizoctonia solani on sugar beet,Precision Agric, DOI 10.1007/s11119-011-9237-2
