Modeling dynamical processes with differential equations (ODE's) and parameter fitting
by using the
Excel® Solver
This project is currently under construction/extension, April 2022.
Summary: this project works out how to estimate successfully the parameters of numerically solved differential equations by the use of Excel® and its add-in Solver
Introduction
In this project we are not discussing the behavior of single or systems of differential equations with respect to changes in parameters, but use such equations as regression functions for the analysis of field and lab trials of different research areas. Or simpler, a quick and easy approach of modelling and parameter estimation is introduced. Hence, we are facing two problems simultaneously. First to identify and model the processes involved with respect to data available, and secondly to fit such ODE based models to those data. As ODE's are rarely solvable analytically, two numerical processes are required, again simultaneously. First the numerical integration of ODE's by Euler, Runge-Kutta (RK), or RK-Fehlberg (RKF) methods for example, and second a fitting procedure to identify the parameter vector which fit the data best. To discuss the problems of both procedures is left to the mathematicians and not the concern of this project.
Both methods are potentially available in Excel, while Solver is a standard add-in for parameter estimation problems, plenty of ODE integrators for the numerical solution are provided for download from the Internet. The background how Solver approaches the optima is not clear, but experiences show the fitting algorithm avoids (visually) local optima, and can tackle even most complex model structures and curve shapes with a sufficient precision.
The challenge is apparent simple, realization is another thing and the purpose of this project. Solver maximises (or minimises) the value of one target cell by varying the values of a given parameter vector. Once started Solver is not stoppable (as I am aware of), hence after every parameter change Solver must be interrupted to start the integrator for the solution of the ODE. The solution is a cell related Visual Basic (VBA) function with a list of parameters. Changing one of the variables manually starts automatically the integrator and solves the complete ODE with the new value. To test the effect of that parameter change, we must calculate the related test statistics (i.e. residual sum of squares etc.) completely on VBA level.
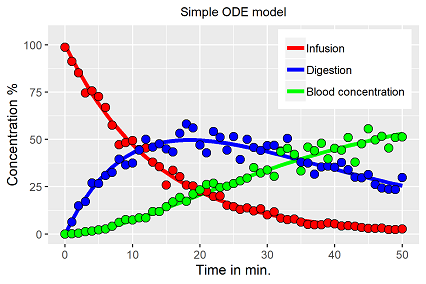
Example:
Let say cell Q41 of the working sheet is the target cell where all the required calculations are summarized. The target cell contains the following function:
=InitiateRSSCalculation (Q3; Q4; Q5)
with three parameters of the ODE in cells Q3, Q4, Q5 to estimate.
On VBA level the function:
Function InitiateRSSCalculation (para1 As Double, para2 As Double, para3 As Double)
RSSCalculation para1, para2, para3
InitiateRSSCalculation = para1
End Function
calls the main subroutine RSSCalculation with the numerical integrator and residual sum of squares calculations, returning the result in para1 to the target cell Q41.
For each change in one parameter value, the main subroutine must complete one run of the whole system of differential equations.
The structure of the following subroutine Sub RSSCalculation(par1 As Double, par2 As Double, par3 as Double) is described more as a to-do list.
The following components are included:
- Initiating and setting needed parameters
- Shifting measurement data from sheet to a VBA array;
- Define the model by ODE's;
- Set initial values; (very important);
- Running the numerical integration loop for the chosen x-axis size or time axis;
- Comparing the ODE result with the observation for the current x-value and calculate the residual square for each time step;
- Loop end;
Calculate the resulting RSS or R² or maximum likelihood value, or whatever you are choosing for the comparison, and return that value to the calling function InitiateRSSCalculation, automatically changes the content of cell Q8.
-
Comments:
- The list of parameter of the subroutines cannot be replaced by range definitions, for example “Q3:Q5”. (Someone might find an alternative solution, but not me), each parameter must be declared separately;
- R² values are apparently of little information value in non-linear models, but it helps to get a relative feeling about the fit and it is dimensionless, therefore applicable for all scales;
- The calculation of variance and confidence ranges of the estimated parameters are end user concerns;
After the basic concept is established, you can run the Solver to fit all parameter simultaneously (restricted to the limited numbers of the Solver add-in) Editing Solver, both the target cell (Q41) and the variables (Q3; Q4; Q5) are set. If you take the RSS for criteria, minimise target cell, using R² values maximise the target cell. Run the solver. Alternatively, use the VBA Code of the Solver add-in.
With respect to model size and computer speed and due to the tedious calculations it might take a while.
The system is extendable in any order, allows complex horizontal regressions, but also simultaneous vertical (multi-experimental regression problems) regressions, for example to identify and quantify related response functions. It is up to user how complex his underlying model should be. To condense the complexity to one target cell is the challenge. And again, further limits are set by the Solver parameter capacity.
Recommendation: ODE's behave sometimes extremely odd beyond certain parameter ranges (so called chaotic), and I am sure, you have functions, which squeeze such numerical integrators to the edge. That is not difficult. Furthermore sudden changes on the y-axis are a significant problem for the integration and must be avoided in any circumstances, means so called 0,1 step functions are prohibited. Example: switch function, which initiate or stops dynamical processes are principally including two major problems, a) you must get them as smooth as possible, and b) you have to avoid overflow problems (even nowadays), as you need to carry the switch function over the complete integration period, means at the beginning or end of integration most extreme value might occur.
