Modeling and density estimation of Heterodera schachtii populations


The animated gif chart demonstrates the dynamics of both, the nematode (top chart) and the sugar beet (bottom chart) in one specific year based on a age structured Leslie model. We developed a specific host - parasite function, controlling some of the hatching probabilities of nematode stages as well as the development rate of the host. A time bar is added for better orientation.
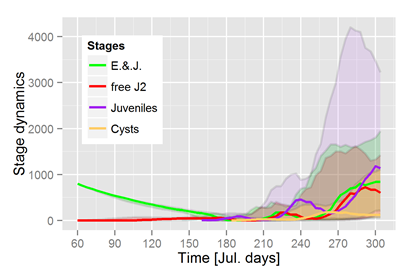
While the difference equation model dealt with the common number of generations per season, we follow a different concept with the Leslie model. Within this model concept growth and development of H. schachtii is controlled by two factors: first mean daily temperature and second the availability of fine roots biomass. Hence, with respect to the slow juvenile development of the sugar beet, it takes quite long for the appearance of the first juvenile stages in the crop (fig. 2, at about Julian day 160). The first cysts develop around Julian day 190, the beginning of the second generation is around day 210. The variance demonstrate that occasionally the appearance of new juveniles might happen as early as day 190, the following development stages vary accordingly. In the range from mid September to the beginning of October we observe another amplitude of new cysts. The hatching probability of the cysts decreases with respect to a lower concentration of fine roots in the top soil, as a function of sugar beet development. Those individuals reaching the cyst stage at autumn temperatures are collected in this stage, all others individuals are rejected from the population at the cut of day 303. The season is defined from March to October. Most interesting, all simulations show two complete generations only, independent what temperature have been recorded. As a consequence more than 2 complete cyst generations have not been found with any temperature pattern. But, as fig. 2. demonstrates, not only different appearance probabilities have a certain variance caused by temperature patterns, but also the population density varies significantly with temperature. The effect will be explained in more detail as, by chance, the impact of rising temperatures got part of this project.

