Nemaplot hyperspectral data analysis and population modellingEvaluation reinvented


Modeling and density estimation of Heterodera schachtii populations

Damage beet cyst nematode
Field symptoms of H. schachtii
Growth reduction by H. schachtii
Heterodera schachtii Cysts, eggs, Juveniles
Sugar beet canopies with BCN

Decision making by crop rotation designs

Formerly a Java applet for online applications have been placed at this position. The security demands of Java or browsers of today are so strict, the applet does not even run on my own computer anymore. Alternatively, we produced the results graphically for all combinations available and provide the basic backgrounds.

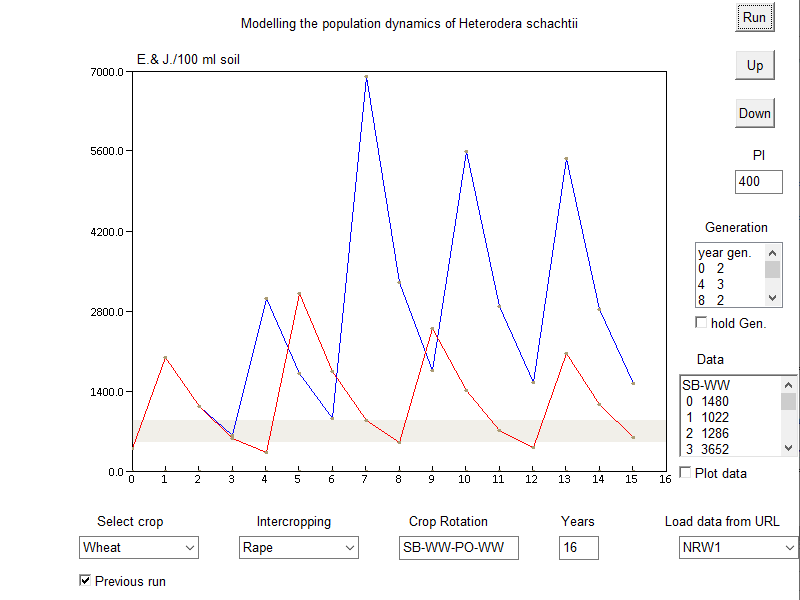
The model predicts the long term dynamics of BCN Heterodera schachtii on a discrete year axis. An initial value of the population Pi (or an estimator of that value) is required. The numbers of generations per sugar beet season determine the population growth (usually 2 or 3, see table 1) with (susceptible) sugar beet varieties, the chosen non-hosts as part of the crop rotation reduce the population with crop specific rates. Both processes result in crop rotation specific population densities. The objectives are to keep the population density of BCN below the threshold level of 500 E&J/100 ml soil at planting sugar beet. The threshold value must not be seen that strict anymore, depending how much risk you take, up to ~800-900 E&J/100 ml soil might be tolerable (gray area in fig. 1).


Table 1
Generation Climate
1 cold
2 standard
3 warm
4 very warm
5 nowadays possible ?

Small insertion:

The overall population range or theoretical model boundaries generated by the choice of generations and size of crop rotation are shown under the following Link forward


The following abbreviations of parameterised crops are used: SB: sugar beet; WW: winter wheat; WB: winter barley; RA: rape; BE: beans; OAT: oat; RYE: rye; MA: maize; PO: potato; SG: summer barley; SW: summer wheat;
The following intercropping species are implemented: (RA): rape; (MU); mustard; (OIL): oil radish; PH: Phacelia; mustard and oil raddish as resistant varieties, rape in short time culture (ca. for 6 weeks).

Average population dynamics of Heterodera schachtii
Fig. 1: Longtime population dynamics of Heterodera schachtii with 33% and 25% sugar beet in a crop rotation. Assumption: advance population increase in year 6 (three generations, crops SB-WW-WB, blue line), and respectively in year 4 as part of the bottom end rotation with 25% sugar beet. (SB-WW-PO-WW, red line)


Fig. 1 defines the range of a common population example, objectives are to keep the population of H. schachtii Population within an acceptable range. For example, the 25% sugar beet rotation keeps the population (with given climatic conditions) within the range of interest (grey area), while the 33% rotation ends up above the tolerance level.

Procedure

Step 1: Create a crop rotation from the parameterised crops available.
Crop rotation selection
Fig. 2: Set up of a crop rotation


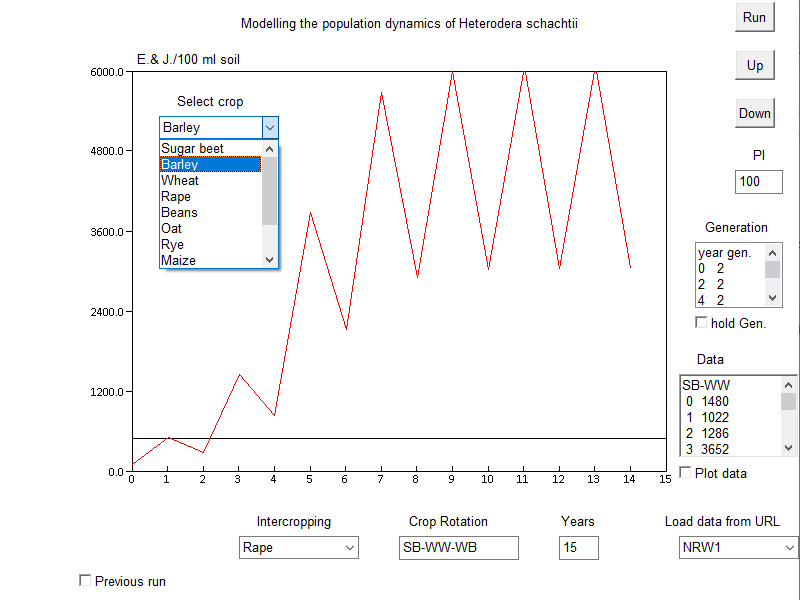
Choose the crops from the menue to create a reasonable crop rotation

Step 2: Choose an intercropping procedure (kind and/or position within the rotation
Decision of intercrops
Fig. 3: Set up of intercropping procedures


Step 3: Address the crop rotation combinations with respect to target
Optimisation of crop rotations
Fig. 4: Optimization by different intercropping strategies as part of the crop rotation


Within the defined population range of fig. 1 we can test different catch crop strategies, both in kind and timing. The blue line represents the standard rotation (fig. 4) SB-WW-WB. The rotations has been extended by a resistant mustard variety after winter barley (SB-WW-WB-(MU), green line). Alternatively, the position of the mustard can be varied within the rotation (SB-WW-(MU)-WB, orange line). In comparison, both and only the double intercropping strategy (SB-WW-(MU)-WB-(OIL), brown line) and finally the 25% SB rotation SB-WW-PO-WW (red line) fulfill the conditions to keep the populations within the tolerable range (grey area). The simulated differences among the crop rotation combinations appear marginal after 15 years, nevertheless are significant with respect to the multiplication potential of Heterodera schachtii. The defined risk range is not met in standard conditions (and given climatic conditions), the population approaches to crop rotation specific populations densities when crop losses in sugar beets are most likely (for susceptible varieties).
Decision against intercropping
Fig. 5: Negative effects of catch crops at low nematode densities


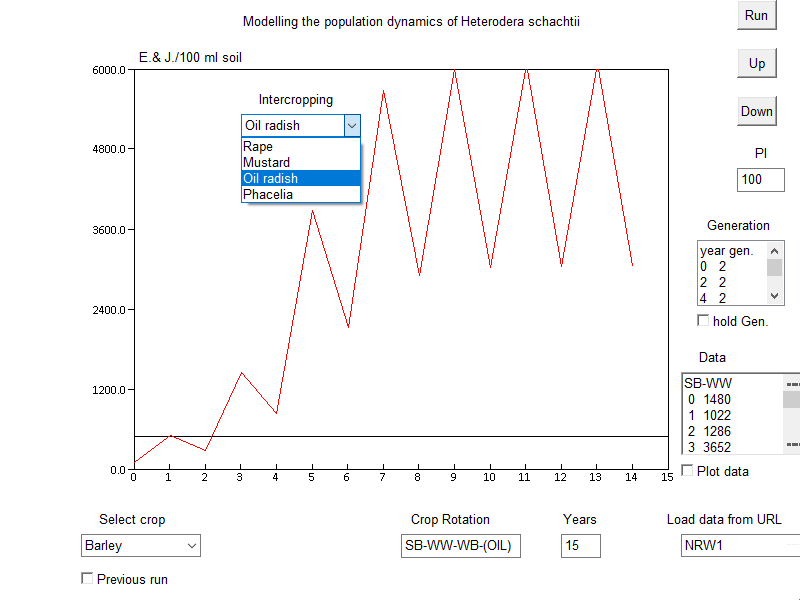
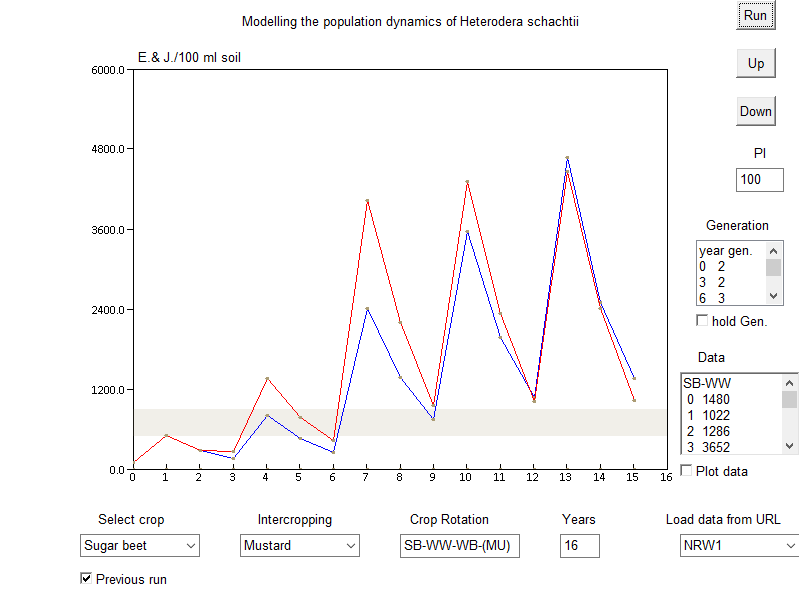
The use of resistant intercrops might have a negative effect if the initial population is (far?) below threshold level. The population increases compared to crop rotations without catchcrops (red line), the critical density range is exceeded in year 9. It takes another two rotations (year 15) to get a significant lower population than the standard rotation again.

back Back to difference equation model Continue to Leslie model forward


Accept

Nemaplot uses cookies to provide its services. By continuing to browse the site you are agreeing to our use of cookies. More information (in German only)