Density estimation of Heterodera schachtii populations by hyperspectral sensors on a biological time scale
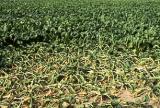
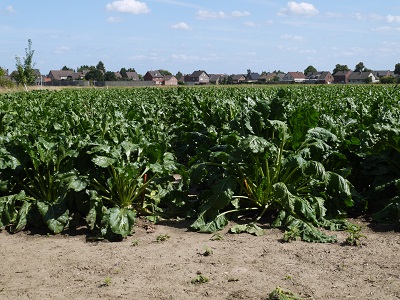
What is the origin objective of this project? Is it possible, just and only by remote sensing technology and hyperspectral information from sugar beet canopies ( as shown in the icon picture right) to establish at least a rough density estimator of the underlying H. schachtii population?
To test the hypothesis and solve the given challenge all components of the Nemaplot H. schachtii project are going to be combined. Hyperspectral information and given multivariate statistical procedures as the discriminant analysis (DA) and General Linear Modeling (GLM) have been tools to check their potential to derive and quantify the soil borne pest from remote sensing data from crop canopies. The target E&J/100 ml soil is masked by several superior factors due to multiple interactions within the host - nematode system. In fact, the nematode impact on the hyperspectral signal in lab as well as in field trials is unexpected small, despite high population densities. These superior factors are variety, year effect (i.e. weather) and date of measurement during the season. While the variety effect is fixed by the chosen variety, the introduced host-parasite model standardize the two other factors. For the required transformation the Leslie model is not running on a real time scale, but based on the biological time concept, i.e. Degree Days, derived from the temperature response functions of the host (fig. 1, 2) and nematode development (temperature sums at base 8 as an approximation is doing fine as well). The alternative time scale summarizes the (temperature) events of all years, providing a normalized development of both the host and the nematodes. The advantages are obvious, it allows not only the comparison of the dynamics of several years, but combines all data of four years of the hyperspectral field experiment within one analysis. Finally, the transformation provides a data set of sufficient size for the GLM procedure, which transform the weak hyperspectral signal of H. schachtii into a numerical dimension. The analysis of the field trials has already shown that the ability to find a more or less linear correlation with sufficient performance from hyperspectral signal to nematode density varied with the date of measurement in every year. In conclusion, not the E&J/100 ml soil are the target (in fact a number, which is long gone when measurement are taken in July/August), but the current nematode stage density in the crop (there is no need to stress the obvious, nevertheless the number of nematodes in the crop is not easily to diagnose). By using the Leslie model we can identify some population numbers at any time of the season. Even they are simulated only, and have possibly no reference to reality, they are repeatable and and can be referred to the hyperspectral signature. In fact, the Leslie model is used as the calibration tool for the hyperspectral information.
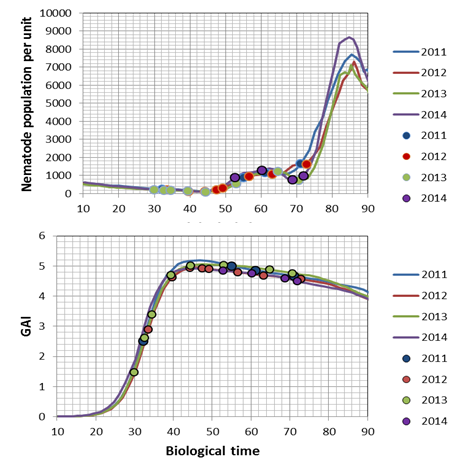
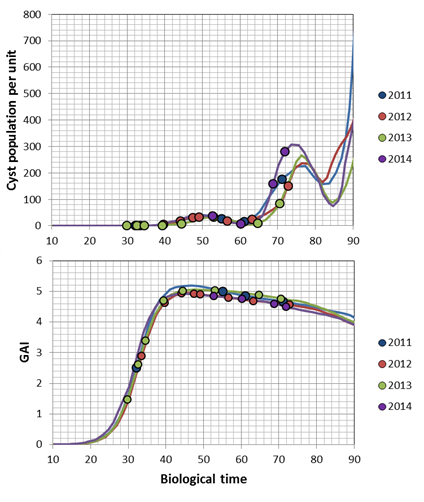
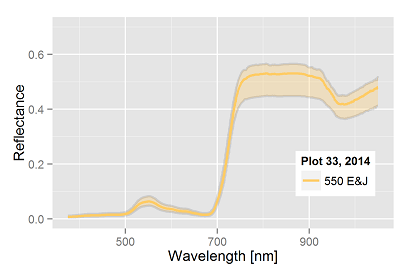
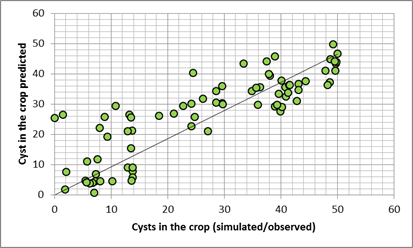
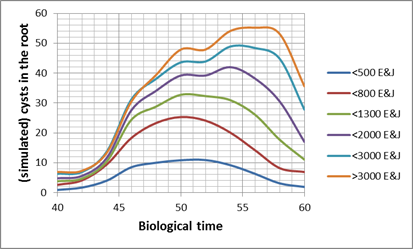
The transformation of the host-parasite system results in the following charts for a Pi of 1000 E&J/100 ml soil. The dots represent the dates of hyperspectral measurements in each year: The bottom chart of fig. 1 & 2 presents the trajectories of the sugar beet canopy (Unit Green Area Index, GAI) as a result of the temperature files of 2011 to 2014 (with the assumption of planting when a DD8 of 60°C is completed). The population dynamics of H. schachtii based on the Leslie model correspond similar. Up to a biological time (BT) of 60 the development rate is completely controlled by temperature, i.e. it is possible to establish a standardized nematode development as for the crop (fig. 1, 2 top). At end of season (BT>60) the massive population increase is a function of the host and not anymore solely controlled by temperature. To focus the results we distinguished between all nematode stages (fig. 1) and the dynamics of the cysts (fig. 2). Taking the Leslie model as the tool for the determination of the biological time, three dates of interest for hyperspectral measurements exist. At a BT of ~35, relates approximately to the J3 stages in the root tips (fig. 1 top), at a BT of ~50, when a temporary maximum of cysts in the root is noticed (fig. 2 top) and finally at a BT of ~60, a second maximum of all stages (fig. 1). In fact the GLM procedure have not been able to identify a significant correlation between hyperspectral signature and the number of nematode stages at BT 35 as well as BT 60. Only at BT 50 the procedure approximates with a sufficient precision (fig. 3), i.e. the hyperspectral signature corresponds with a certain number of (simulated) cysts, how they would have been expected with the temperature files from 2011 to 2014. The resulting parameter estimates are depicted in the following table:
| Constant | A | B1 | AC1 | BC1 | AL1 | B1 | B2 | AC2 | BC2 | AL2 | BE2 | B3 | Acrit3 | Bcrit2 | al3 | be3 | b4 | Acrit3 | al4 |
| -3391.25 | 287.05 | -3.78 | 11.17 | 6.3 | 4.39 | 1526.51 | -1.56 | -0.96 | -38.28 | 9.04 | -172.42 | 3.37 | 1.01 | 1.017 | 1.98 | -0.12 | 145.03 | -2.11 | 5.70 |
For explanation of the model parameters AC1, BC1, ... etc. and how they are estimated?
We refer to the top project of
hyperspectral data analysis 
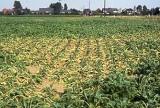
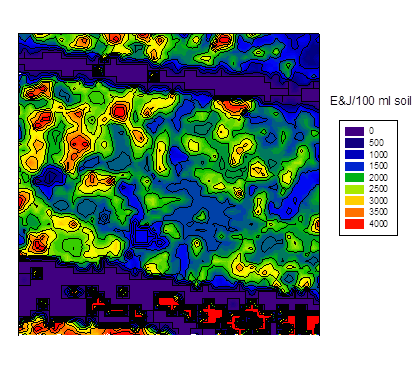
plot in 2013 with 4000 E&J
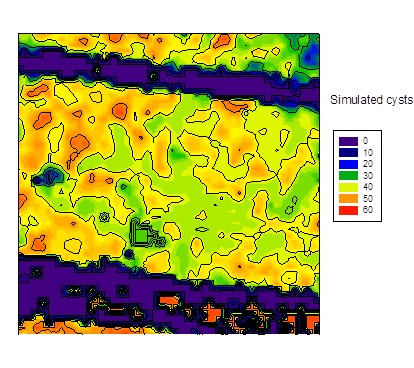
estimated from hyperspectral aerial image at BT 50
at planting sugar beet
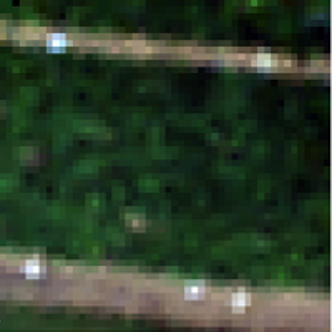
It is necessary to refer to the chapter "image analysis" again. It can be shown by a small adaption of the transformation vector to the wave length specification of the Cubert camera to estimate the cysts distribution (fig. 6 b) from a hyperspectral aerial image of a field plot (fig. 6a), which again leads to the following E&J distribution at spring (fig. 6c). Numerical artifacts are noticed in the area of pathways, it should be ignored. There is no hard evidence about the distribution shown in fig. 6c, but the GLM vector calculates very high cysts or E&J numbers, they in fact correspond with the soil samples of the plot in the range of more than 4000 E&J/100 ml soil.
Resume: Yes, the system does the job, and that is more than fascinating. Measuring a sugar beet canopy at the right date with a hyperspectral sensor provides
a numerical estimator about the nematode population in the soil. Error levels are high for sure, but, as usual in nematology, certainly
not larger than soil sample based decisions. No counteraction is possible for the current crop (is that true? Are systemic nematicides out there?), but
integrated nematode control deals with long term decision making and sustainability. Similar as the backward calculation of the original Pi the Leslie model and
Difference model calculates forward, from
Pf to Pi at next sugar beet. The concept introduced here implement a complete system for the H. schachtii control.
The host-parasite model is certainly not perfect and mimic just parts of the reality (how ever that reality looks like), but only the combined application
of both model types results in a perhaps hypothetical population density number at a time of the season when hyperspectral signatures respond with structural
changes indicating the nematode impact. Exactly at that date the Leslie model correspond with a temporal maximum of cysts in the crop, which is more than plausible.
The complexity and intensity, as female adults or cysts deter the crop physiology for the production of new eggs, let expect a change in the signature.
The physiological process have been part of the underlying working hypothesis right from the beginning of the project. Based on the information
about the dynamics of the host-parasite interaction model this critical date have had been expected in the range of a BT of ~35. No
decent linearity or other meaningful structure from spectrum to population density (i.e. number of J3) were possible at this date.
We introduce a technique which have been developed to observation data in conjunction with local temperature pattern of the Rhineland, Germany. Although
a common applicability of the system is wanted and likely, further investigations on other sites are required.
One more practical hint to the current end of the project: The importance of the right date for hyperspectral measurement has been
sufficient described, but it is also crucial to measure in not wilting canopies and without water stress, when leaves are flattened. The changed reflections
would focus on soil reflections and would mask the weak nematode impact again.
The hyperspectral data have been measured as part of a Nemaplot initiated and EU financed Project at the JKI Elsdorf (EU-funding no.: z1011bc001a)
