Density estimation of Heterodera schachtii populations with hyperspectral sensors in field plot trials

The effect of BCN in terms of hyperspectral data analysis
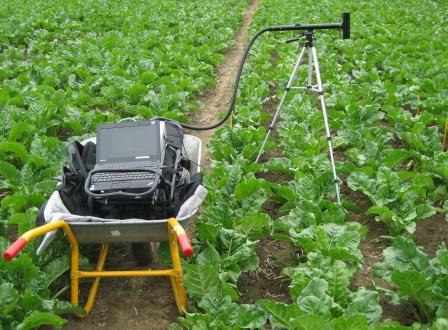
Background: H. schachtii can have a massive impact on a sugar beet root system and its physiology. The additional energy transfer from leaf to the root system should be somehow seen in changes of the hyperspectral signature. At least you can see above soil symptoms in form of wilting (sometimes). Is it therefore possible to extract information about the nematode density from hyperspectral signatures of sugar beet canopies? To test the hypothesis we attended a variety trial at the JKI (Site Elsdorf, Rhineland, Germany, 50°56'21N, 6°33'48E) from 2011 to 2014. Multiple non-invasive hyperspectral measurements from sugar beet canopies were taken during the seasons. The related Pi values were recorded from soil samples before planting sugar beets.
Plot layout and spatial distribution of H. schachtii
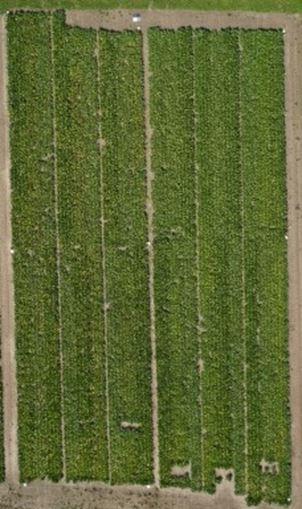
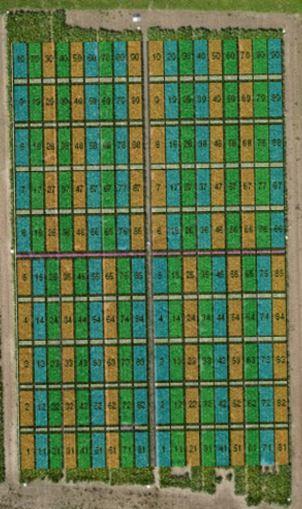
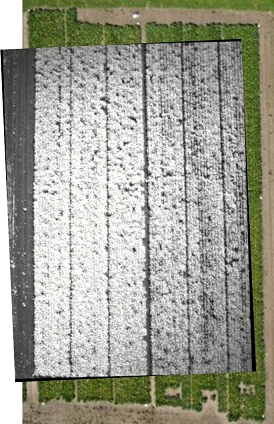
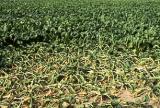
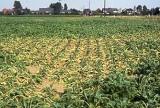
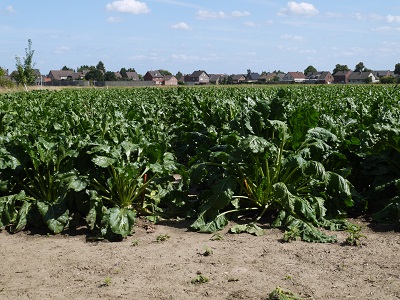
The aerial image (fig. 2a) demonstrates the major problem of the whole experiment:
no year has shown any symptoms despite truly high population densities up to the range of more than
5000 E&J/100 ml soil (yellow-red area, fig. 2c), the expected wilting or any other symptoms have not been visiable
in the canopies. Even the infrared image of a multichannel camera did not reveal an hints about the
underlying population density of the nematode. Not even the different varieties (susceptible, tolerant, resistant) or the single plots are visible in the aerial image. Canopies have been
developed above average due to warmish conditions, drought stress did just occurred occasionally.
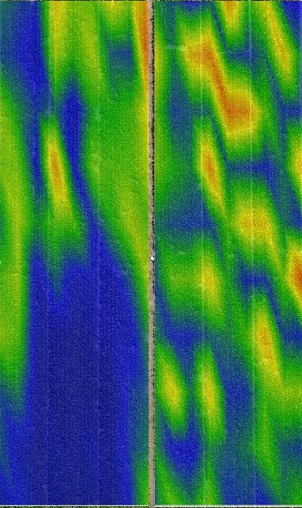
What can be detected by the sensor or at least differentiated?
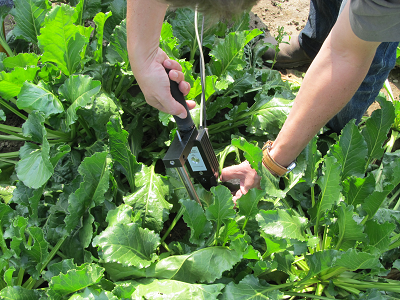
One result first: measurements with the plant probe in the field situation (fig. 1b) have been much too work intensive. Additionally, no real advantage has been noticed compared to above canopy measurements (fig. 1a). Therefore this kind of measurements were stopped. The result introduced here are all based on measurements above canopy (fig. 1a).
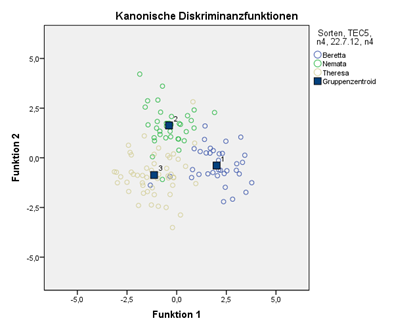
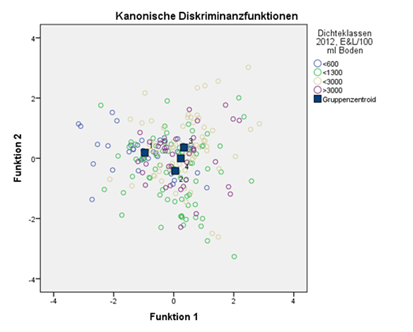
The combination of our hyperspectral data analysis and discriminant analysis highlights a clear variety effect (fig. 3). But the nematode population is of main concern.
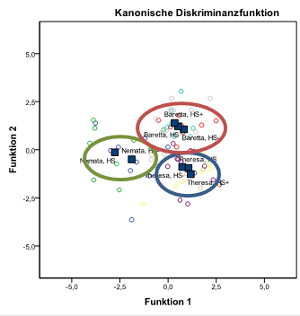
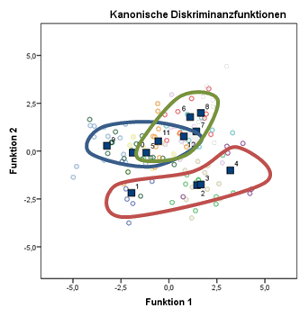
The discriminant analysis demonstrates an interaction of varieties and nematode. The colored framed areas describe the variety effect, the distance within the areas are the nematode effect. The variety x nematode combination are indexed. Taking the distances as a dimensionless measure, the dominance of the variety effect is obvious, the nematode effect is an extremely weak trait.
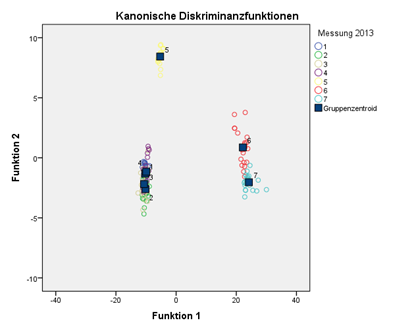
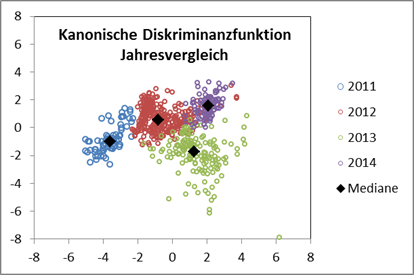
Furthermore the measurement date during the season (fig. 5) as well as the year (fig. 6) have an effect on the signature and is disguising the impact of H. schachtii.
Summary: the nematode effect is the bottom end of a couple of superior factors, which control the hyperspectral signal more dominant.
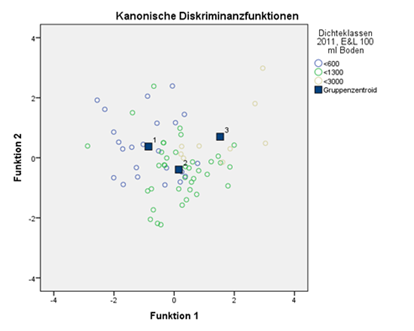
Excluding the superior factors from analysis, i.e. taking the measurement at one specific day, year, for one variety and cluster the E&J data to discrete density classes, the nematode related differences can be shown by the statistics (fig. 7a-d), ie. even H. schachtii has an impact on the hyperspectral signal, the last factor of the whole row.
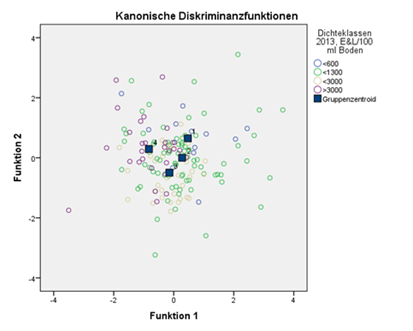
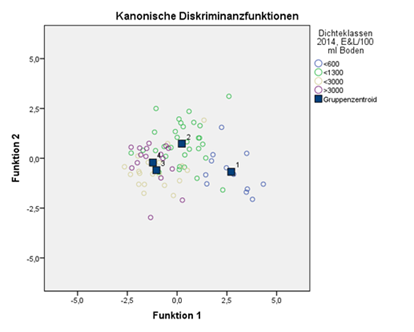
A repeatable pattern is not detectable among years. Each year shows significant differences, which reflect more or less the temperature controlled dynamics of this specific year. Although the results of the trials stay behind expectations, the four year experiment provides the basics for a more advanced analysis. Part of the extended analysis is a) the small but important detour to the "General Linear Modeling" Procedure (GLM), where a linear correlation is constructed between the hyperspectral signature and the E&J, and b) the dominant factors masking the nematode, as described before. The application of the introduced Leslie model provides the possibility to standardize the dominant factors "year" and "measurement day" by a biological time concept within the Leslie model. The model combination of Leslie model and GLM allows the establishment of a correlation of number of cysts at a certain data on the biological time scale.

