Phenotyping, heritability & trait recognition, part II: details and examples
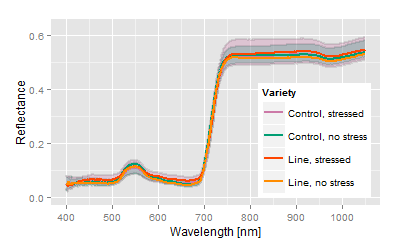
Example: 50 breeding lines including the control lines with more than 800 plants have been exposed to a medium stress during growth and development. The hyperspectral signals of those crops were measured with the plant or contact probe. The measurements of all crops took about 7 hours. The crops have been in the middle of development, but slight stress and senescence patterns have been noticed.
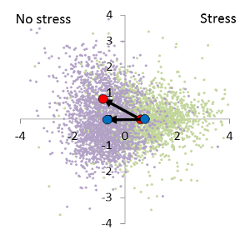
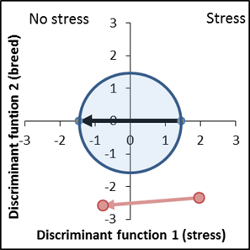
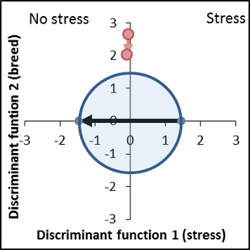
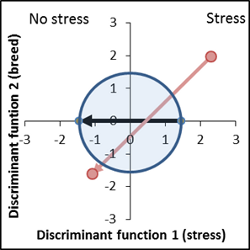
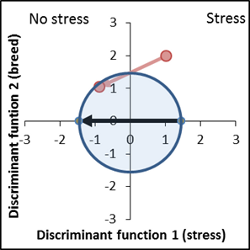
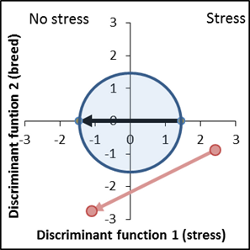
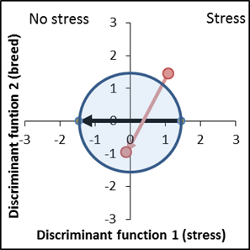
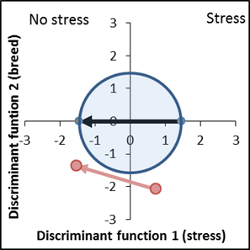
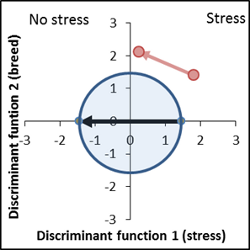
The individual scores of the discriminant analysis show the usual large variance, but the average stress effect (x-axis) as well the breeding effect (y-axis) are significant and can be shown on the discriminant area. The result is a characteristic genotype/stress interaction. The mean of the stress free variants varies from the control (distance from the blue to red point in the unstressed half of the discriminant area), while the stress factor masks the genotype effect.
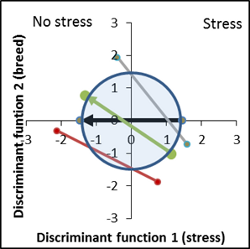
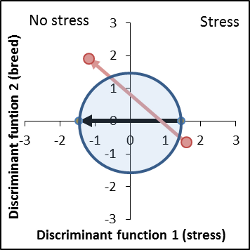
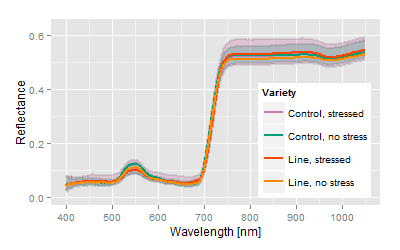
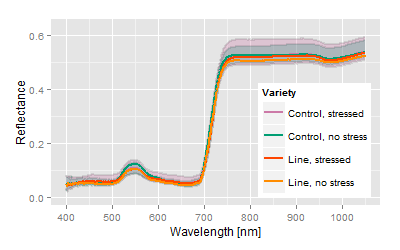
Overview of variety performances based on hyperspectral comparison of vector length and position
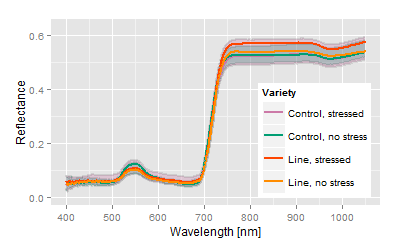
| Spectrum | Vector position | Explanation |
|---|---|---|
 |
 |
No genetic difference to control variety, increased response to stress factor ( vector length of the breed is larger than the control vector). |
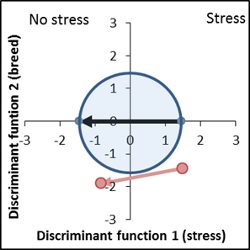
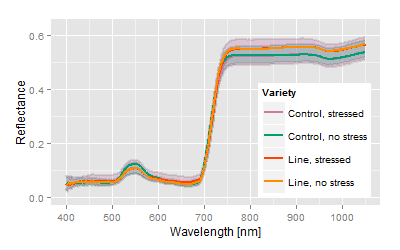
 |
 |
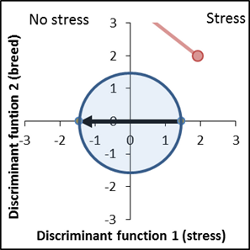
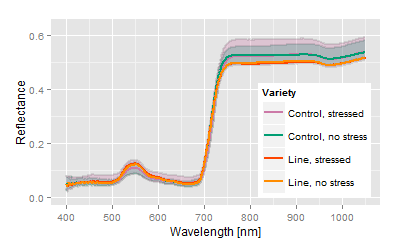
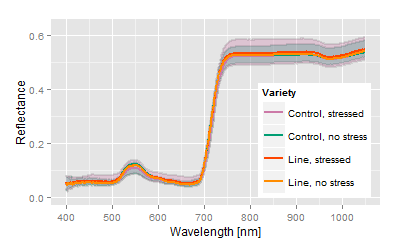
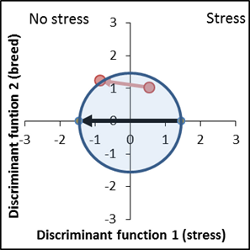
Genetically very different, stress response level is similar to control. |
 |
 |
Breed line phenotypically extremely different from control, stress tolerance high, very good performance with respect to important traits. But probably not suitable for breeding, as the phenology is too extreme. |
 |
 |
Bottom end extreme: poorest performance in all traits, largest deviance in the phenology, not suitable. |
 |
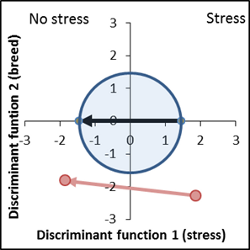 |
Genetic distance is very large, but stress performance is 30% less than the control. |
 |
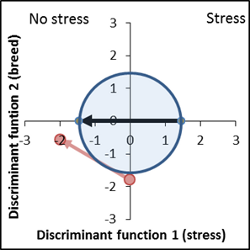 |
Ideal genetic position, stress tolerance is improved by 20%. |
 |
 |
No genetic difference by position, stress susceptibility is extremely high |
 |
 |
Very interesting variety, reduced response to stress. Vector lies within the apparent area of interest. Mean signatures are in the bottom end of the confidence intervals. |
 |
 |
Very high deviance from control, stress response is disproportionate strong. |
 |
 |
No difference, but high similarity to control. |
 |
 |
Another example of a best performing line. Vector is in the right position, vector length is 50% smaller than the control. |
 |
 |
Again, the given criteria show a very interesting line, but slightly poorer performance than before. Both lines are breeds from a similar genetical base. |
 |
 |
This line shows a significant improvement concerning the induced stress, vector is shorter than the control, genetic distance position in the optimum area. |
 |
 |
Example for a false decision: very interesting line on the first view, very small stress response vector, the vector position indicates the wanted breeding progress. But The "classical" trait analysis shows no difference compared to the control. |
Summary
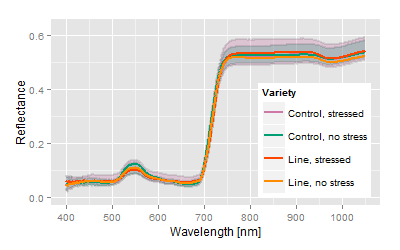
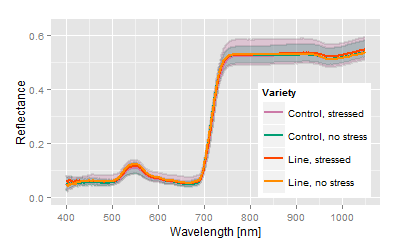
Most obvious, the hyperspectral signatures do not show major differences among the varieties, but the analysis spreads the differences concerning the trait of interest. The canonical distance areas provide the platform to image and to compare both, the stress related differences as well the genetic related differences.
The accuracy for a correct decision of the examples given here is in the range of 80%
| Classification | True | False |
|---|---|---|
| no differences | 25 | 6 |
| Differences | 14 | 5 |
1Data were sampled as part of a breeding experiment of the MPI PZ Köln, Dr. Schmalenbach, performed at the Campus Klein Altendorf of the university of Bonn
