Phenotyping, heritability & trait recognition
The techniques introduced here are also applicable for traits recognition in plant breeding
and most suitable for early line selections. The canonical distances demonstrate both the experimental
factor ( here an induced stress) as well the genetic similarity compared to the control.
Example: 50 breeding lines including the control lines with more than 800 plants have been exposed
to a medium stress during growth and development. The hyperspectral signals of those crops were
measured with the plant probe. The measurements took about 7 hours. The crops have been in the middle
of development, but slight stress and senescence patterns have been noticed.
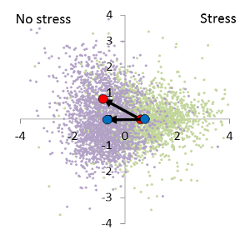
The individual scores of the discriminant analysis show the usual large variance, but the average stress effect (x-axis)
as well the breeding effect (y-axis) are significant and can be shown on the discriminant area. The result
is a characteristic genotype/stress interaction. The mean of the stress free variants
varies from the control (distance from the blue to red point in the unstressed
half of the discriminant area), while the stress factor masks the genotype
effect.
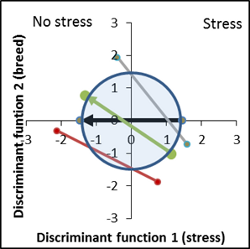
The canonical distance of the control variety yielded in a value of 3 (already an intensive stress in absolute terms). This value determines the intensity of the stress as the standard for the new breeding lines and describes the base line vector on the horizontal axis (black arrow). The distances of the new lines rotate with respect to the base line on the canonical area. The following pattern has been noticed: the majority of the line vectors, not different from the control, are located within an circular area defined by the size of the control. Or, vice versa, vectors not belonging to the inner circle or where origin and endpoint is not part are outside of the control area, are significant different from the control. But, and that is very important, it does not mean a breeding success if the line vector is far away from the control area, it just describes the relative differences compared to the control with respect to an introduced stress or other traits of interest.
Follow the link for a more detailed analysis, statistical parameters and conclusions in plant breeding
and phenotyping ... more

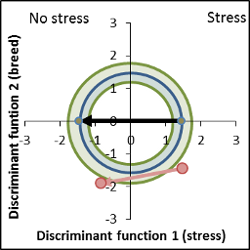
As an empirically result of the analysis a confidence area of the circular area can be defined, containing the most interesting lines for further breeding programs with respect to stress resistance. 1) the vector of the stress of the line of interest have to be smaller than the control vector and 2) the genetic distance should be inside or scratch the confidence area (fig. right, green area). Vector positions within the interior circular area are not different from the control (usually in combination with similar distances compared to the control). Varieties with vectors outside the confidence area show slight "improvements" in some cases, but in most cases a genetic setback, or a deviance from the ideal phenotype. The genetic distance is too large, resulting in growth depressions and completely different phenotypes. It is assumed that the control variety has gained top end levels with respect to the traits of interest. Hence the breeding progress has reached levels of diminishing margins. Therefore, lines with a larger genetically distance seem to be suboptimal, their trait potentials are reduced.
The precision of the introduced technique concerning a correct decision is in the range of 80%.
As the selection of parent lines for a breeding program is more and more based QTL information, it is assumed to find direct correlations between the parameters estimated here and the line QTLs.
