Overview hyperspectral image analysis
 The technique developed and introduced here is also applicable
for the analysis of hyperspectral images. Again, the complete information of one spectrum is used within the fitted model, but for each pixel this time.
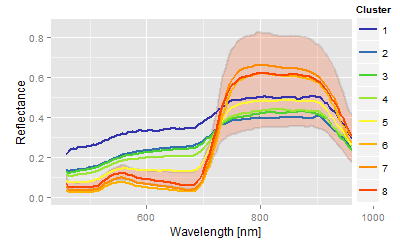
Contrary to classification with respect to the experimental design with known classes the situation varies within the image situation, as all continuous steps of one
factor are somehow depicted here. Consequently we use a cluster analysis instead of the discriminant analysis. The cluster analysis does not require a beforehand
classification.
The downy mildew, (Plasmopara viticola)) experiment is chosen
again as an
example1. Parallel to infected leaf measurements with the plant probe,
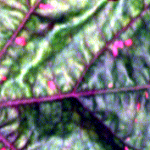
hyperspectral images have been taken by a line scan camera. The RGB image (right) depicts
the upper side of a leaf. It tests the question how pathogen related pattern of the lower side of the leaf are detectable on the top side based on hyperspectral
information. To test the hypothesis the problem is partitioned in several steps after model fitting.
The technique developed and introduced here is also applicable
for the analysis of hyperspectral images. Again, the complete information of one spectrum is used within the fitted model, but for each pixel this time.
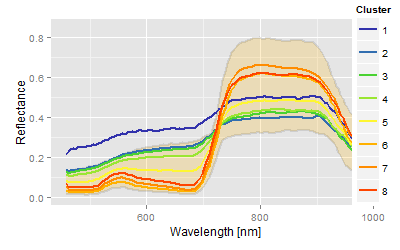
Contrary to classification with respect to the experimental design with known classes the situation varies within the image situation, as all continuous steps of one
factor are somehow depicted here. Consequently we use a cluster analysis instead of the discriminant analysis. The cluster analysis does not require a beforehand
classification.
The downy mildew, (Plasmopara viticola)) experiment is chosen
again as an
example1. Parallel to infected leaf measurements with the plant probe,
hyperspectral images have been taken by a line scan camera. The RGB image (right) depicts
the upper side of a leaf. It tests the question how pathogen related pattern of the lower side of the leaf are detectable on the top side based on hyperspectral
information. To test the hypothesis the problem is partitioned in several steps after model fitting.
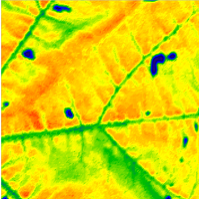
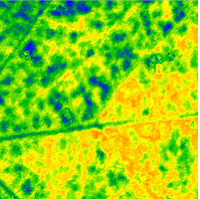
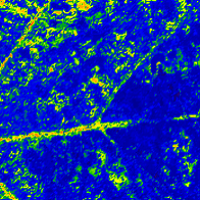
The parameters describing the relative position on the y-axis, image the origin very well (left), other parameters are important by its physiological meaning(center), and further parameters of the model show a weak conformity with the RGB image.
Application in field experiments
To test the developed index we used a camera image of the company Cubert 2 taken from a sugar beet field of the JKI Elsdorf. The scientific background was to test the ability of density estimation of the sugar beet nematode based on the hyperspectral information of the sugar beet canopy. The data were part of the a Nemaplot Kai Schmidt initiated and EU-funded project and were taken at the JKI Elsdorf. The report (German only) can be downloaded from the link on the right. The report explains the background of typical, nematode related spectra for the nematode problem. To explain the picture below, the population density of nematodes is usually estimated from extremely laborious soil samples, means, the spatial distribution in field situations of the worm is known, on smaller scales the density is based on one or two soil samples and nothing is known about the distribution. Density estimation of
Heterodera schachtii with hyperspectral signal from canopies, ca. 3 MB,
(in German only
Density estimation of
Heterodera schachtii with hyperspectral signal from canopies, ca. 3 MB,
(in German only| Hyperspectral image | Explanation |
|---|---|
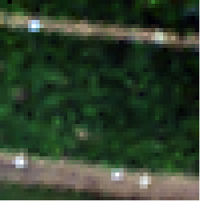 RGB transformed hyperspectral image
of a sugar beet plot with an extremely high population density of about
4000 eggs and larvae / 100 ml soil determined by soil samples.
The plot is framed by pathways, the plot boundaries are marked by
white standard markers. Picture is taken with a Cubert2
camera, the usable wavelength ranges from 400 to 900 nm. RGB transformed hyperspectral image
of a sugar beet plot with an extremely high population density of about
4000 eggs and larvae / 100 ml soil determined by soil samples.
The plot is framed by pathways, the plot boundaries are marked by
white standard markers. Picture is taken with a Cubert2
camera, the usable wavelength ranges from 400 to 900 nm. |
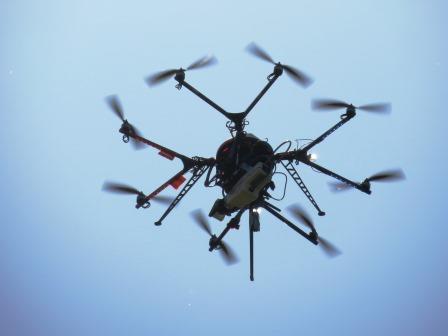 Octocopter based Cubert2- camera with a resolution of 50 x 50 pixel.
 |
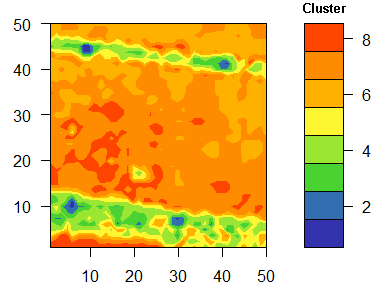
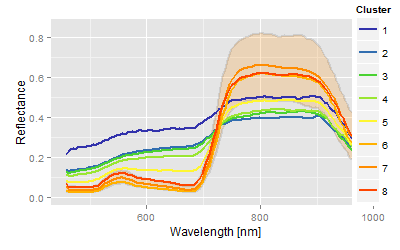
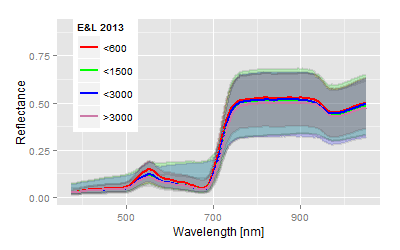
Conclusion: The combination of aerial information and the confidence areas of the spectra allow some kind of conclusion about the underlying nematode population, or, more theoretically, it links the more abstract clusters more or less with the scientific hypothesis of the experiment.

