Dynamics of optical properties of decaying meat
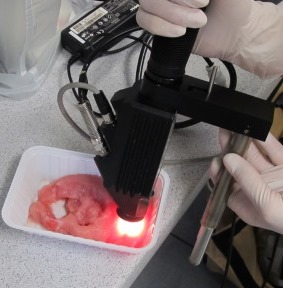
Is it possible to address the quality or freshness of cutlets by hyperspectral signals. To define the dynamics of decay processes of fresh meat low fat cutlets were The decay fate of pork chops stored at 4°C was monitored for two weeks. The meat was taken directly from the production line and instantly prepared for further analysis and storage in the lab. Total viable counts (TVC) values were determined from perforated meat blocks on different days after delivery. In total the complete procedure was repeated nine times, while the number of backs per delivery varied from 2 to 11, resulting in 9 time courses of decay observations with related repetitions. Contemporary to the standard sampling the meat was scanned by the hyperspectral sensor including the contact probe. The contact probe provides an undisturbed reflectance signal using an internal light source. The spectral measurements were taken on the same day as the lab measurements. The hyperspectral signature shows a distinctive pattern at day 0 which characterises the type of meat and its current condition. These signatures vary with time while changes occur mainly in the visible domains. The measurements were repeated several times, the following figure depict the means of the complete experiment.
| Hyperspectral Signal | Explanation |
|---|---|
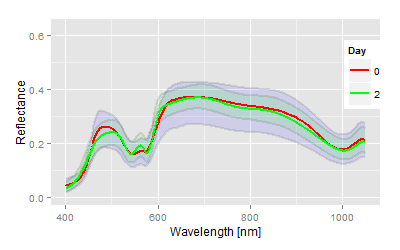 |
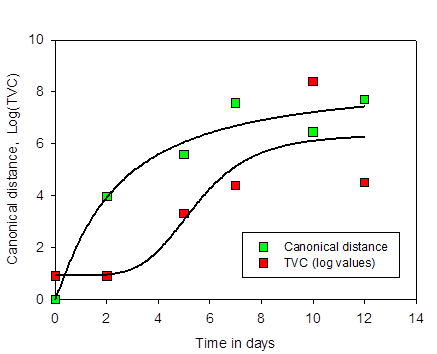
The fresh meat produces a specific reflectance spectrum at day 0, at the beginning of the measurements, distinctive amplitudes in the visible domains, weak patterns in the IR domains (red line). Mean variations are high (blue area), as several charges are combined. Most interesting is the peak in the domains 560, 590 nm. Fresh meat on day 0 shows an advanced absorption at this wavelength, while the peak (reflectance) increases already after 2 days at 4°C. While the mean bacteria loading (log (TVC)) has not changed yet (lag-phase), the canonical distance determines already a strong and significance change from day 0. It means at a first conclusion, the colour has changed, may be to some kind of oxidation and indicates processes, which are not entirely related to bacteria growth. |
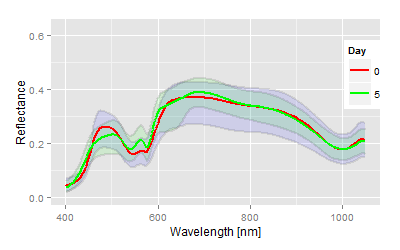 |
The spectrum continues to change at day 5. Those changes mainly affect three domains. More light is absorbed at 480 nm, the peak at 560 to 580 nm is more expressed and the signature flattens at 620 nm and some more changes at the top end of the visible light (680,690 nm). The canonical distance increased from 4 to 6, indicating further changes, deterioration of the meat. TVC values are in the range of 3.5. |
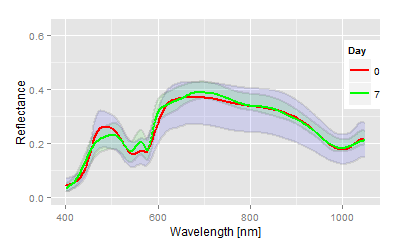 |
Two more days increased the bacteria loading to 5, the signature differences compared to day 0, are getting more and more obvious. The focus of the changes continues to be at the domains 620 nm and 680, 690 nm. The mean canonical distance is in the range of 7 now, indicating very strong differences. |
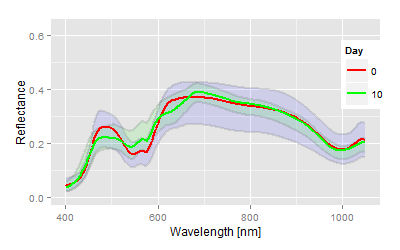 |
The advanced deterioration of the cutlets at day 10 also affects larger wavelength ranges of the reflectance signature. The peak at 570 nm and the patterns at 580 to 680 nm are vanishing more and more, indicating massive changes in the meat structure and consistency. The maximum at 690 nm is characteristically expressed. The TVC values are in the range of 8, the meat is smelly and deteriorated. |
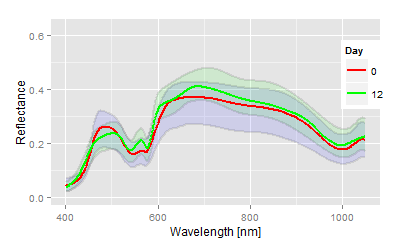 |
But this example has to be shown as well: it appears that all the processes are apparently reversed at day 12, although the peak at 690 nm is well expressed. In fact large parts of the cutlets taken into account at this date included meat which contained very low TVC values after 12 days (and even more strangely, it looked even fresh after that long time!!!). The measured TVC are in the range of 4, which correspond to densities at day 7. Most interesting the hyperspectral signature correspond to day 7 as well and does not indicate deterioration processes, which are expected after such a long time. |
Continue to optical properties of different meat types

