NIRS analysis (Near infrared spectroscopy)
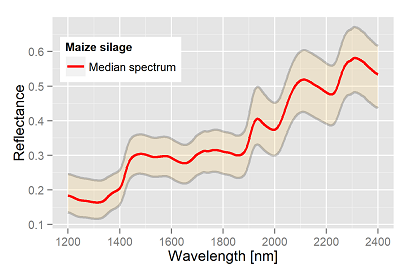
The NIRS analysis is one more most interesting focus of optical and remote sensors. The method is suitable for the determination of ingredients of certain materials. Main focus are the ingredients of farming products as cereals, corn, flour, forage, aso., parameters in terms of dry matter, carbon hydrate, protein, oil and energy content of the products. Simply, the method compresses and simplifies complex chemical analysis methods just by a ratio of reflected and transmitted light.
The following equation for the quantity or concentration of a compound is valid:
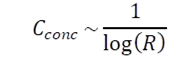
under ideal conditions. The problem, those conditions are nearly never ideal due to different reasons. Hence, the spectra are calibrated or fitted to specimen with known compounds, for example based on chemical analysis methods. A couple of calibration procedures are available, all of them plausible, as the samples are smaller than die number of parameters to be estimated, normally the wavelength range of the sensor, here from 1200nm to 2400nm. Have you sampled enough specimen, i.e. the samples are significant larger than the number of parameters to be estimated, you can recapitulate the whole procedure with any numerical method without too much loss of information.
Example: To determine the usable energy potential of maize silage for biogas plants, the following parameters are simultaneously measured/estimated from one NIRS specimen:
DM, XA, XP, XS, XL, XF, oNDF, oADF, ADL, EULOS (Explanation in table 1)
The energy content of maize silage is determined by linear regression of those parameters. The precision is determined by the 1:1 ratio of observed versus predicted. To demonstrate potential outlier of our approach all data are presented as figures in the image series below.
| Abbreviation | Explanation | 1:1 precision, R2 values |
|---|---|---|
| DM | dry matter in % | 0.94 |
| XA | crude ash | 0.96 |
| XP | crude protein | 0.93 |
| XS | starch | 0.94 |
| XL | crude fat | 0.94 |
| XZ | sugar | 0.94 |
| XF | crude fibre | 0.97 |
| oNDF | organic neutral detergent fibre | 0.98 |
| oADF | organic acid detergent fibre | 0.97 |
| ADL | acid detergent lignin | 0.92 |
| EULOS | enzyme solvable organic substance | 0.96 |
-
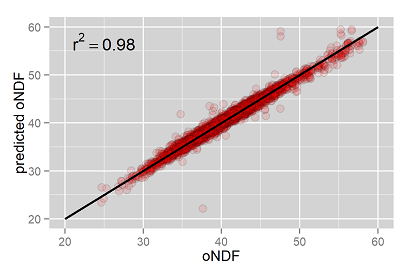
oNDF estimation and 1:1 precision 1/11 -
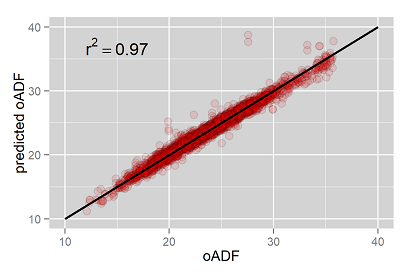
oADF estimation and 1:1 precision 2/11 -
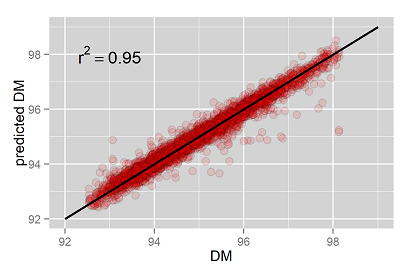
dry matter estimation and 1:1 precision 3/11 -
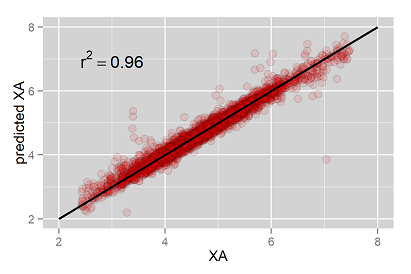
crude ash (XA) estimation and 1:1 precision 4/11 -
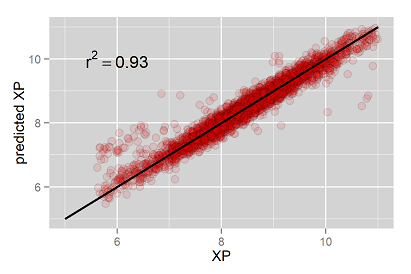
crude protein (XP) estimation and 1:1 precision 5/11 -
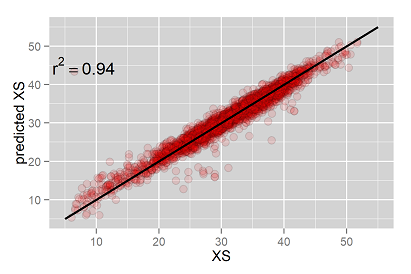
starch (XS) estimation and 1:1 precision 6/11 -
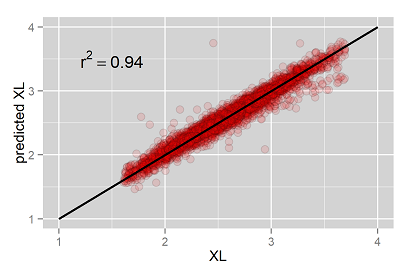
fat (XL) estimation and 1:1 precision 7/11 -
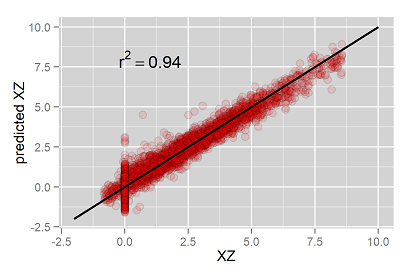
sugar (XZ) estimation and 1:1 precision 8/11 -
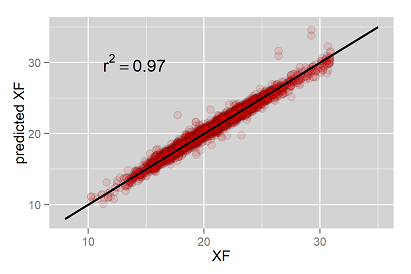
crude fibre (XF) estimation and 1:1 precision 9/11 -
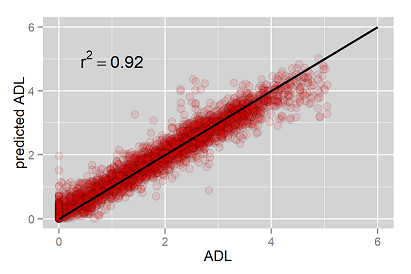
ADL estimation and 1:1 precision 10/11 -
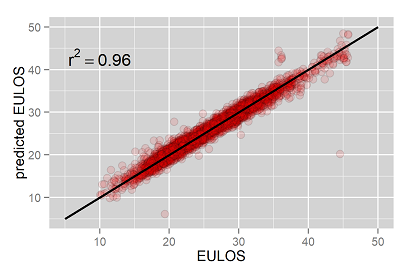
EULOS estimation and 1:1 precision 11/11
Quality check:
As demonstrated, some ingredients are estimated with poorer precision. In total, we are dealing with numerical methods, as the commercial variant as well as the method introduced here. Occasionally some of the estimates are unrealistic and beyond any plausible range, for example dry matter contents of 105%. Means, some more statistical procedures to detect outliers have to follow up, most simply by confidence bands.

