Case study 5: Factorial experiments, ex. field salad
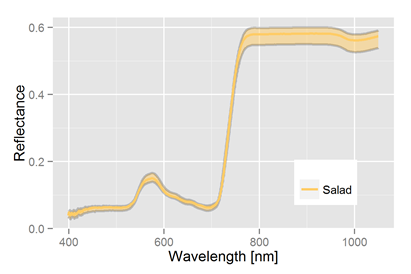
Another example how hyperspectral information are applied for monitoring agricultural trials and how advanced experiments are analysed within half a day. A three-factorial experiment (variety, radiation and fertiliser) with field salad grown in a glasshouse have been measured by a "plant probe". Four plants were taken from each repetition, leaf measurements were performed at mid time of the growing period. The result has been a very homogenous signature with a low variance (fig. 1)
The experimental design needs some more explanation: UVB+ and UVB- describes a radiation factor, which determines the light transition of glasshouse roofs, or which part of the radiation is blocked or able for transition. Furthermore, especially due to an insufficient data size with respect to the experimental complexity, the fitting procedure has been repeated for three times with an initial parameter vector derived from the previous fitting. The treatment effects would not be observable with the standard procedure, as it is expected by the mean signature. The parameter fitting followed by the discriminant analysis yielded the following canonical scores, determining both, the means or cluster centers and the common variance (fig. below).
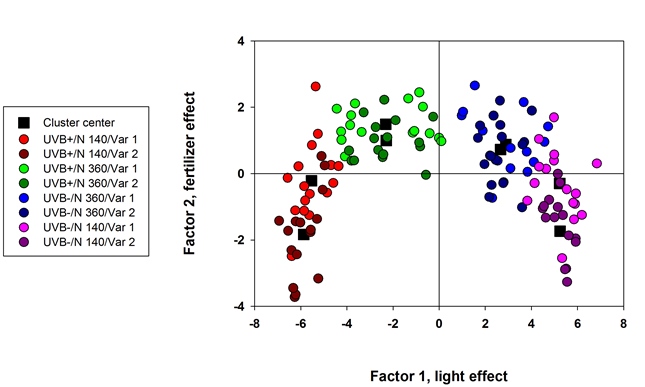
Most interesting and despite the low variance we find the structure of the underlying experimental design within the scores (Fig. 2). The left (with UVB+) and right (no UVB-) quadrant describe the radiation effect. The range of the fertilizer is shown in the upper and lower quadrant. Using the average canonicial distances as a measure, the scores show the largest influence of the radiation (horizontal axis). The distance on the fertiliser axis is smaller, but still significant (vertical axis). The scores also demonstrate a significant interaction of both, radiation and fertiliser. The UVB effect is smaller in the 360 kg N/ha variant , and no influence of either fertiliser and/or variety is seen (top quadrant). How is the variety effect? None in the high N treatment, and a low one ( a value of 1.8 is on the boundary to significance) at the 140 N kg/ha treatment (bottom quadrant).
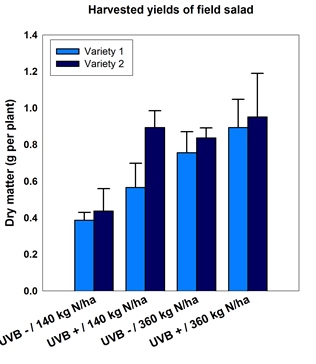
Data from harvesting resulted in the following findings compared to the hyperspectral measurements three weeks before (Fig. 3): the fertiliser effect is the only remaining one. No UVB or variety effect is found in the 360 kg N variant. The combination of UVB- x variety x 140 kg N demonstrates the missing of any variety effects. Just the UVB+ x 140 kg N variant shows a variety effect of variety 2 compared to variety 1. Variety 2 achieve the same results as the 360 kg N variants. What is the final outcome: Seeing the variety 2 combination as an outlier, just the N fertiliser has had an effect on the yield. There might be a trend for a synergistic effect of UVB+ in case of lower fertiliser supply, but not significant.
Summary: the hyperspectral measurement have been taken during the main growth phase of field salad, overall the outcome has been predicted well just in parts. The most obvious UVB effect on yield cannot be confirmed, or more precise, is hidden by the most dominant effect of the fertiliser treatment. The obvious synergistic effect of both radiation and N is not that clear in the yield data, but there seems to be a trend. The missing variety effect has been identified correctly. This statement is again somewhat limited: The hyperspectral data indicated variety 1 a the better candidate, as the distances to high N treatments have been smaller.
1Data were sampled at the Campus Klein Altendorf of the university of Bonn, results provided by T. Kraska
