What makes the use of optical properties so fascinating?
- High information density
- High measurement throughput
- Objectiveness of measurements
- Applicable for highly complex experimental designs
- Non-invasive, non-destructive, ideal for the analysis of time series and the recording of dynamical processes
- Reproducibility of the experiment and the results
- Repeatability of the measurement
- Implementation of several standards, for example varieties, defining the actual genetically boundaries or variability.
- Suitable for most quick ad hoc greenhouse trials
- Similar analytical ranges with respect to classical statistics based on destructive measurements
- The spectra summarise all events to which the measured leaf/individual has been exposed to, accumulated and condensed. Enabling events to be identified and partitioned from the spectra.
- The individual crop is marked by its spectrum and allows the consideration of its individuality.
- Quantification of control variables (factors like the intensity of biotic and abiotic stress) are possible.
- Full and immediate control over your experiments.
- Continuous trial monitoring
The search for new traits or varieties and the testing new pesticides, fertilisers requires extensive lab, greenhouse and field experimentation. Treatment effects are frequently examined on different scales using the physiological conditions and properties of single plants and entire populations by destructive harvesting and lab analytics. These usual standard procedures are often labour and time consuming, cost intensive and use important resources. Results are often only available late after the end of the season following intensive post harvesting data preparation (e.g. dry matter, yield, grain size).
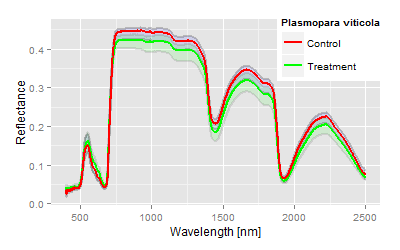
The spectrum summarises all events to which the crop has been exposed to during its growth and life processes. As the measurement characterises the individual plant or organ, variance are high, but on average the method highlights the induced treatment, as for example variety, phenotyping traits, abiotic stresses (salt, drought, ozone, etc.), fertiliser or pathogen impact.
We transform these individual spectra to a numerical vector by our patented procedure and introduce an arbitrary, but dimensionless scale based on canonical distances. The individual object (i.e. plant, leaf, meat or tissue, etc.) is characterised by the specific hyperspectral reflectance or alternatively by its frequency of model parameters. The discriminating power of this method is very high, especially as the complete spectral information is used, not only certain domains, as in the most commonly used indices. Even apparent similar spectra are comparable. This comparison is done with multivariate statistics. The end result is a set of statistical parameters that provide a rigorous answer to questions posed. Not only qualitative decisions are made, but, based on the canonical distance scale, also quantitative results are possible. (more details)
We deliver this unique type of analysis for your individual experimental data in time and with low extra cost.
This new method offers clear benefits in terms of the analytical resolution that can be obtained but also the real time nature that data can be gathered and the results analysed. Check the performances of your trials early and fast. Control and manage your treatments at the onset of your treatment effects. As the hyperspectral reflectance technology allows high-throughput measurements and repeatability, more advanced experiments are possible and the dynamics of your treatments can be examined more intensive and even before visually noticeable.
Detailed background information of the underlying experiments are not required, anonymity of your data is guaranteed.
What do you get?
- We provide a combination of statistical
parameters which give evidence about your induced treatment taking
into account your experimental design;
- Graphical charts for a quick overview;
- A more thoroughly interpretation of the results;
- The degree of intensity of your induced factors;
- A quantitative comparison of your input factors and results based on the scale of canonical distances from multivariate statistical procedures;
Limitations:
- Discriminated treatment effects based on hyperspectral reflectance information do not necessary mean a treatment effect of related size at harvest or any other trait of interest.
- Here, as assumed for classical t-tests or ANOVA: the inverse argumentation or hypothesis testing is not allowed, means, detecting no treatment effects does imply your active substance has no effect. This converse argument is not legitimate.

