Continuation of the grapevine experiment
| Average canonical distances of potential mean comparisons | |||||
| Combination a, all factor level |
Distance | Combination b, pathogenicity of the inoculum |
Distance | Combination c, genetically difference |
Distance |
| MT x Downy Mildew | 1.23 | MT | 2.65 | MT vs. RE, control | 2.08 |
| RE x Downy Mildew | 1.47 | RE | 2.43 | MT vs. SO, control | 1.79 |
| SO x Downy Mildew | 0.64 | SO | 1.87 | RE vs. SO, control | 2.26 |
| MT vs. RE, w. pathogen | 3.69 | ||||
| MT vs. SO, w. pathogen | 2.51 | ||||
| RE vs. SO, w. pathogen | 3.86 | ||||
Summary of the 2nd trial
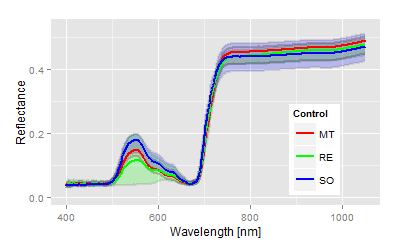
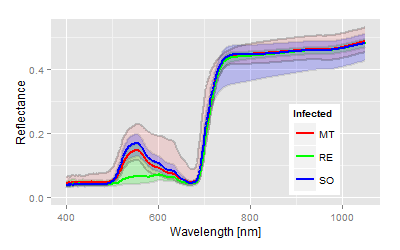
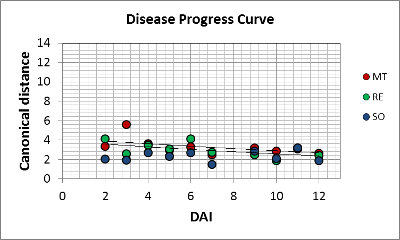
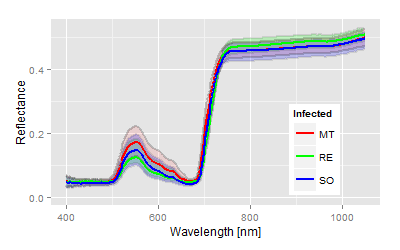
Although the analysis of hyperspectral information yield in difference in terms of statistical parameters, but the differences are more or less based on an atypically behavior of Regent. A massive anthocyan production in all leaves was observed in the treatment variant as well in the control. The numerous outlyers of Regent generate the extreme variance in the hyperspectral signatures (green area under the mean curve). A similar skewed distribution can be observed for infected cultivar MT (red area above the mean curve). Summarising the observations based on the canonical scores and distances shows a complete failure of Regent within the experiment. The relative differences between MT and SO are noticeable, but the impact of P. viticola is poor in this case. The distance values are at the bottom end of significance. The pathogenicity of the used inoculum appeared to be 3 to 4 times lower compared to the first experiment. More or less the usual symptoms of P. viticola have not been noticed, a fact repeated by the values of the statistical parameters. The time series based on the canonical distances did not recapitulate the dynamics of downy mildew.
Variety experiment, the 3rd
Despite accurate preparation of the inoculum and incubation, the degree of infection have been disappointing in the former trial. Therefore the experiment has been repeated for a third time in autumn of the same year with the same cultivars and the same size of plants.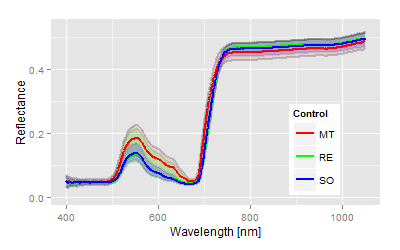
| Average canonical distances of potential mean comparisons | |||||
| Combination a, all factor level |
Distance | Combination b, pathogenicity of the inoculum |
Distance | Combination c, genetically difference |
Distance |
| MT x Downy Mildew | 4.3 | MT | 4.7 | MT vs. RE, control | 1.31 |
| RE x Downy Mildew | 2.5 | RE | 3.4 | MT vs. SO, control | 3.66 |
| SO x Downy Mildew | 1.5 | SO | 2.6 | RE-SO, control | 2.78 |
| MT vs. RE, w. pathogen | 2.71 | ||||
| MT vs. SO, w. pathogen | 2.93 | ||||
| RE vs. SO, w. pathogen | 2.86 | ||||
Results
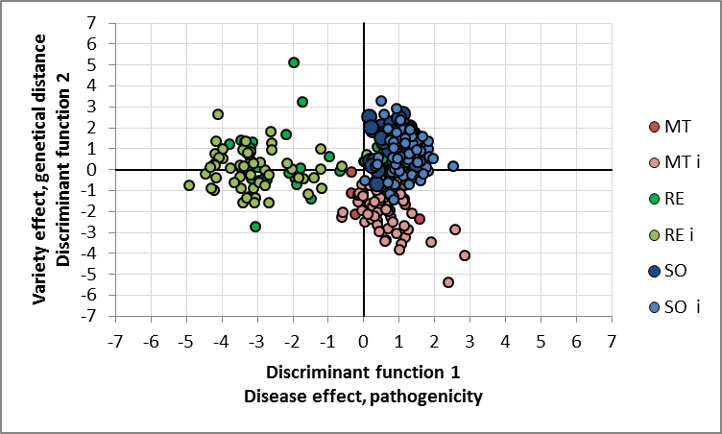
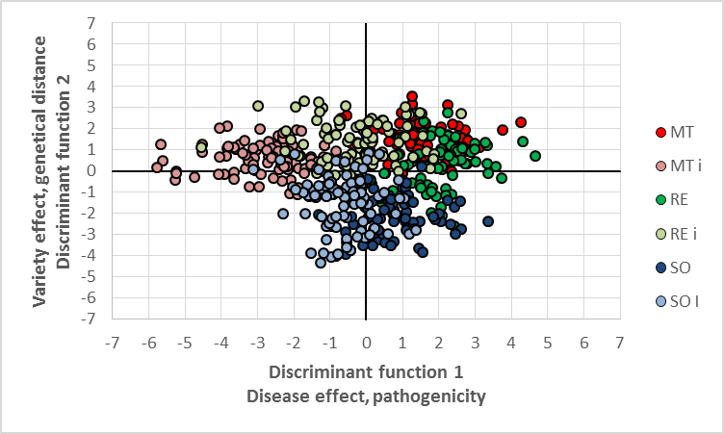
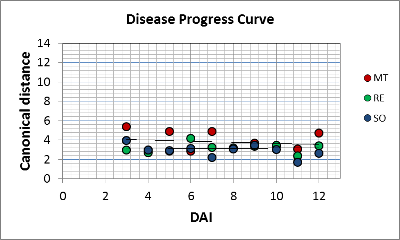
Again, repeating the experiment for a third time reveals similar result than before. The varieties, especially Solaris, differ significantly in the untreated control with respect to their spectra, the leaves of the infected cultivars differ, but not that obvious as in the first experiment. To address the result in relation to the former experiments we use again the distribution of the discriminant scores and the canonical distances. Needless to mention, but Solaris is still different in both phenology and spectra scores compared to the other varieties. Furthermore the score distribution reveals a difference among the infected leaves, but by much lower distances than in the first experiment. Giving an interpretation in relation to the earlier trials we can use again the score distribution and canonical distances. The different leaf phenology of Solaris compared to MT and Regent has been mentioned before. The differences are enhanced by the pathogen, the pathogen effect is higher than in the second experiment, but distances are in the lower range for SO and RE. Only the susceptible variety MT shows advanced differences in the range from 4 to 5. P. viticola caused massive symptoms on single leaves, while other stayed symptom free. The result can be recapitulated from the variance of MT on the discriminant area (light red dots). The scores on the left quadrant represent the leaves with symptoms, heading for the center shows leaf measurements without or light symptoms only. With given distance values of the cultivars RE and SO a potential break of the specific resistance is not assumed here. Concerning the disease progress curves the last experiments were not able to image the dynamics of the pathogen.1 Cultivars have been provided by the JKI Geilweiler Hof, Germany
2 In cooperation with Privat-Dozent Dr. E.C. Oerke,
INRES,
Institute of Plant Protection, University of Bonn, Germany.
